There are two main techniques for solving protein structures: x-ray crystallography and Nuclear Magnetic Resonance (NMR). As can be seen from the current PDB holdings, more than 180,000 protein structures have been solved so far, and are available from the Protein Data Bank. About 88% of these are x-ray crystallographic structures, the rest are NMR structures (7%) and cryoEM structures (5%). As can also be seen on the PDB holdings list, the number of solved proteins grows even faster, due to advancements in structure determination techniques. Nevertheless, the number of known protein sequences is three times larger (currently about 565,000, as available from the UniProtKB/Swiss-Prot database).
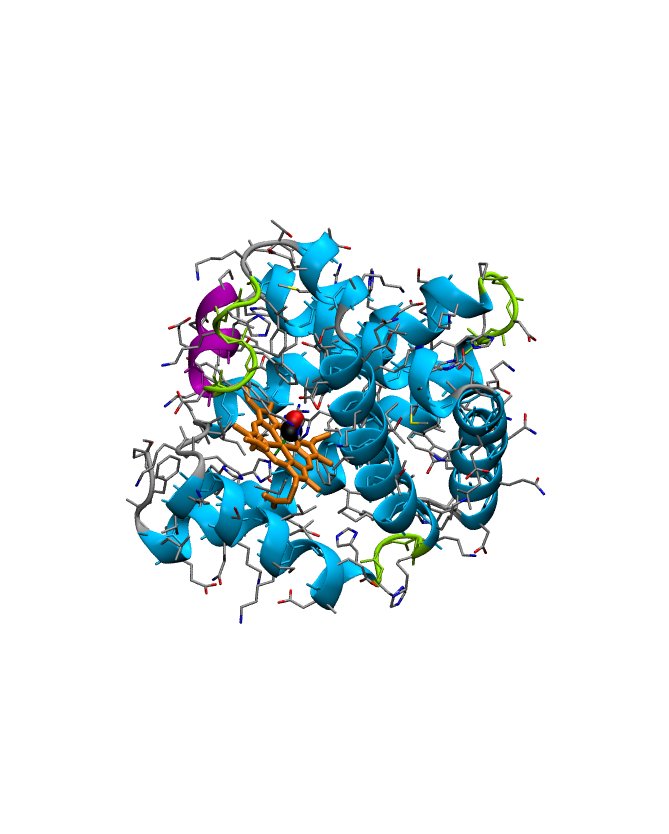
Experimentally solved protein structures are stored at the Protein Data Bank, from which individual protein structures can be retrieved as so-called PDB files. Before we will turn to the structure determination itself, let us have a closer look at a typical PDB file, to see what can be learned about the background of the structure (experimental conditions etc.) and the structural quality (the resolution, coordinate uncertainty). We will focus on PDB entry 1DWR (an x-ray structure of myogloblin complexed with carbon monoxid) as it can be downloaded from the Protein Data bank.
PDB file format
The initial lines of a PDB entry contain information on:
HEADER    OXYGEN TRANSPORT                        11-DEC-99   1DWR
TITLE     MYOGLOBIN (HORSE HEART) WILD-TYPE COMPLEXED WITH CO
COMPND    MOL_ID: 1;
COMPND   2 MOLECULE: MYOGLOBIN;
COMPND   3 CHAIN: A
SOURCE    MOL_ID: 1;
SOURCE   2 ORGANISM_SCIENTIFIC: EQUUS CABALLUS;
SOURCE   3 ORGANISM_COMMON: HORSE;
SOURCE   4 ORGANISM_TAXID: 9796;
SOURCE   5 ORGAN: HEART
KEYWDS    OXYGEN TRANSPORT, RESPIRATORY PROTEIN
EXPDTA    X-RAY DIFFRACTION
AUTHOR    K.CHU,J.VOJTECHOVSKY,B.H.MCMAHON,R.M.SWEET,J.BERENDZEN,
AUTHOR   2 I.SCHLICHTING
REVDAT   3   24-FEB-09 1DWR    1       VERSN
REVDAT   2   29-APR-05 1DWR    1       REMARK HET    HETNAM FORMUL
REVDAT   2 2                           HETATM
REVDAT   1   03-MAR-00 1DWR    0
JRNL        AUTH   K.CHU,J.VOJTECHOVSKY,B.H.MCMAHON,R.M.SWEET,
JRNL        AUTH 2 J.BERENDZEN,I.SCHLICHTING
JRNL        TITL   CRYSTAL STRUCTURE OF A NEW LIGAND BINDING
JRNL        TITL 2 INTERMEDIATE IN WILDTYPE CARBONMONOXY MYOGLOBIN
JRNL        REF    NATURE                        V. 403   921 2000
JRNL        REFN                   ISSN 0028-0836
JRNL        PMID   10706294
JRNL        DOI    10.1038/35002641
[..]
REMARK   2
REMARK   2 RESOLUTION.    1.45 ANGSTROMS.
REMARK   3
REMARK   3 REFINEMENT.
REMARK   3   PROGRAM     : X-PLOR 3.851
REMARK   3   AUTHORS     : BRUNGER
REMARK   3
REMARK   3  DATA USED IN REFINEMENT.
REMARK   3   RESOLUTION RANGE HIGH (ANGSTROMS) : 1.45
REMARK   3   RESOLUTION RANGE LOW  (ANGSTROMS) : 20
REMARK   3   DATA CUTOFF            (SIGMA(F)) : 0.0
REMARK   3   DATA CUTOFF HIGH         (ABS(F)) : NULL
REMARK   3   DATA CUTOFF LOW          (ABS(F)) : NULL
REMARK   3   COMPLETENESS (WORKING+TEST)   (%) : 96.1
REMARK   3   NUMBER OF REFLECTIONS             : 23794
REMARK   3
REMARK   3  FIT TO DATA USED IN REFINEMENT.
REMARK   3   CROSS-VALIDATION METHOD          : THROUGHOUT
REMARK   3   FREE R VALUE TEST SET SELECTION  : RANDOM
REMARK   3   R VALUE            (WORKING SET) : 0.211
REMARK   3   FREE R VALUE                     : 0.255
REMARK   3   FREE R VALUE TEST SET SIZE   (%) : 5.0
REMARK   3   FREE R VALUE TEST SET COUNT      : NULL
REMARK   3   ESTIMATED ERROR OF FREE R VALUE  : NULL
[..]
REMARK   3  RMS DEVIATIONS FROM IDEAL VALUES.
REMARK   3   BOND LENGTHS                 (A) : 0.013
REMARK   3   BOND ANGLES            (DEGREES) : 1.93
Following the introductory material, some specific information regarding the protein and its crystalline form are provided, including:
SEQRES   1 A  153  GLY LEU SER ASP GLY GLU TRP GLN GLN VAL LEU ASN VAL
SEQRES   2 A  153  TRP GLY LYS VAL GLU ALA ASP ILE ALA GLY HIS GLY GLN
SEQRES   3 A  153  GLU VAL LEU ILE ARG LEU PHE THR GLY HIS PRO GLU THR
[..]
FORMUL   6  HOH   *132(H2 O1)
HELIX    1   1 SER A    3  ASP A   20  1                                  18
HELIX    2   2 ASP A   20  HIS A   36  1                                  17
HELIX    3   3 HIS A   36  GLU A   41  1                                   6
[..]
CRYST1   63.600   28.800   35.600  90.00 106.50  90.00 P 1 21 1      2
Then come the actual atom coordinates (or structure), whose listing
takes up most of the average PDB file.
Each listing begins with "ATOM" and is followed by:
ATOM      1  N   GLY A   1      -2.316  16.963  14.230  1.00 20.85           N
ATOM      2  CA  GLY A   1      -2.992  16.384  15.439  1.00 19.00           C
ATOM      3  C   GLY A   1      -2.137  15.253  16.013  1.00 18.18           C
ATOM      4  O   GLY A   1      -2.132  14.129  15.477  1.00 18.59           O
ATOM      5  N   LEU A   2      -1.387  15.560  17.074  1.00 15.98           N
ATOM      6  CA  LEU A   2      -0.561  14.582  17.790  1.00 13.52           C
ATOM      7  C   LEU A   2      -1.065  14.383  19.213  1.00 12.59           C
This goes on for a while, until the end of the peptide chain, which is marked by the "TER" line. If there are any other molecules that co-crystallized with the protein (such as solvent molecules or ligands) they are listed as "hetero-atoms" near the end of the file.
HETATM 1203 FE   HEM A 154      14.347  28.659   5.074  1.00  8.13          FE
HETATM 1204  CHA HEM A 154      15.659  31.898   5.315  1.00  5.90           C
HETATM 1205  CHB HEM A 154      13.490  28.753   8.433  1.00  6.10           C
HETATM 1206  CHC HEM A 154      13.145  25.505   4.903  1.00  5.24           C
HETATM 1207  CHD HEM A 154      15.262  28.616   1.824  1.00  6.55           C
Go back to Contents
X-ray crystallography
 The main technique for determining protein structures is x-ray
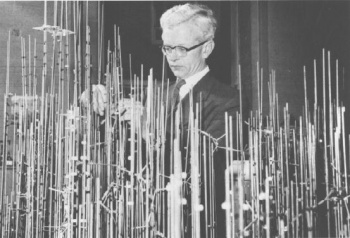
crystallography. Since the first protein structure (myoglobin) was solved by this
technique by John Kendrew and Max Perutz in the late fifties, several
thousand others followed. As can be appreciated from the picture on the right,
which shows John Kendrew with the structural model of myoglobin, at
that time the determination of a structure the size of a protein,
without the aid of a computer, was a formidable task.
The main technique for determining protein structures is x-ray
crystallography. Since the first protein structure (myoglobin) was solved by this
technique by John Kendrew and Max Perutz in the late fifties, several
thousand others followed. As can be appreciated from the picture on the right,
which shows John Kendrew with the structural model of myoglobin, at
that time the determination of a structure the size of a protein,
without the aid of a computer, was a formidable task.
It is important to note that in both x-ray crystallography and NMR,
protein structures are not measured directly in the
experiment. Rather, a set of data is collected (a diffraction pattern
or a NMR spectrum), from which a model of the protein structure
is derived. To appreciate the difference between data and structure,
we'll now look at two different structures of the same protein, and
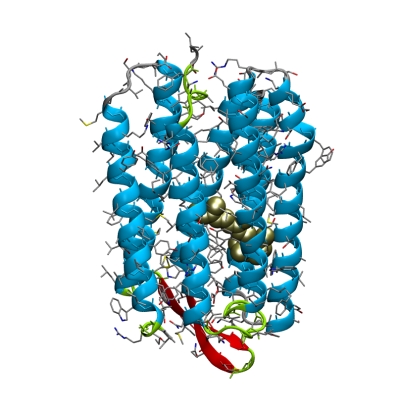
the corresponding x-ray crystallographic data. For this, we will
concentrate on the bacterial light driven proton pump
bacteriorhodopsin. Click
here for more background information on bR.
First take a look two bR structures on the Protein Data Bank, with PDB entries
1BRR and 1QHJ, using a browser on your PC.
Let's download the two structures to the remote CIP-Pool machine:
curl -O http://www3.mpibpc.mpg.de/groups/de_groot/compbio/p3/1BRR.pdb
curl -O http://www3.mpibpc.mpg.de/groups/de_groot/compbio/p3/1QHJ.pdb
 View the structures with pymol:
pymol 1BRR.pdb
hide all
show cartoon, chain A
show spheres, resn RET and chain A
color gold, resn RET and chain A
Question:
By looking at the structures, which of the two structures would you prefer, in terms of coordinate accuracy?
Remember, so far we only looked at the coordinates, which represent a model
that was optimized against the actually measured data. So, let
us now have a look at the data. In x-ray crystallography, data are
collected by measuring a diffraction pattern that is obtained from
x-rays reflected by a protein crystal. As mentioned in the lecture,
this diffraction pattern itself does not suffice to determine the complete structure
since only the amplitudes of the diffracted waves were collected, not
their phases. In x-ray crystallography, however, there are a number of
tricks available (e.g. isomorphous replacement, molecular replacement)
but we will not go into that in detail here. What is important to
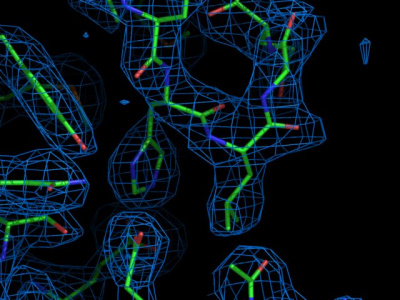
remember is that eventually, an atomic electron density map is obtained.
Question:
Why do primarily the electrons of a molecular sample contribute to the
diffraction of x-rays? answer.
Using the browser on your PC, visit the PDBe server
to view the electron density map 1BRR. Enter the PDB code (1BRR), and
wait for the summary page to load. Several plots with information on
this structure are available. Feel free to browse around to check the
meaning of the individual plots.
Now open this molecular viewer.
Now repeat the procedure for entry 1QHJ. How is the fit for residue
Y83? And for S35? And the retinal?
Question:
Based on the data and on the model structures, would you say there is
a large impact of the resolution of the data on the accuracy of the structural model?
Question:
What ranges of resolution do you think belong to low,
medium and high resolution structures. What are the typical structural
features do you expect to be resolved, respectively.
answer.
The highest resolution x-ray crystallographic structures have a
resolution of approx. 0.8 Angstrom or even somewhat better. To see an example
of such a dataset, look at the density for structure 2B97. Note that you can zoom into the
map by clicking "Shift" on the keyboard and moving the mouse with the left
button pressed. Do you recognize the difference in appearance?
Question:
Although the resolution of this structure is rather high, at 0.75 Angstrom, the
hydrogen atoms (e.g. on the side chains) are still difficult to see. Why is
this?
A measure for the coordinate uncertainty of the individual atoms due to the thermal motion in the crystal is given by
the temperature factor (or B factor).
Low B-factors (< 30) correspond to well-defined parts of the structure, whereas high B-factors (> 80) might indicate highly disordered parts of the structure or even mis-interpreted parts of the model.
Question: How do the temperature factors of a crystallographic
structure in principle compare to the flexibilities of a protein in a MD simulation? answer.
The other main technique for determining protein structures is NMR. In
contrast to x-ray crystallography, no crystals are required for an NMR
experiment. Rather, the structure is determined of the protein in
solution. Therefore, it has the advantage that the protein can be
studied in its native environment. On the other hand, the resolution
of an NMR structure is usually lower and there is a size limitation of
a few hundred amino acids for structure determination using NMR.
It would go beyond the scope of this course to explain the
NMR experiment in detail. We will therefore only briefly touch on the
experimental setup and then focus on the structure building and
refinement step based on the obtained data.
The NMR signal is recorded as a nuclear magnetic resonance spectrum of predominantly the
hydrogen atoms after the sample has been subjected to a (number of)
strong magnetic pulse(s). Mainly hydrogen atoms give rise to the
signal, because of the magnetic spin properties of the hydrogen
nucleus (a proton). The naturally occurring isotopes of the other
elements that are found in proteins, carbon (12C) and
oxygen (16O),
have a zero nuclear magnetic moment. Nitrogen (14N) does
have a non-zero magnetic moment, but can usually not be used in NMR,
for reasons that would go beyond the scope of this course to explain.
These elements, therefore, can only
be utilized in NMR experiments when chemically replaced by a specific
isotope, like 13C or 15N. The most structurally
relevant information is usually obtained from a so called NOESY
experiment (Nuclear Overhauser Enhancement SpectroscopY).
The Nuclear Overhauser Effect or Nuclear Overhauser Enhancement is the
change (enhancement) of the signal intensity from a given nucleus as a
result of exciting or saturating the resonance frequency of another
nucleus. Since this effect is distance-dependent, it can be used to
derive the distance between an interacting pair of protons. In
practice, protons closer than 6A apart can be identified this way.
Now, we will calculate a model of the structure of a small protein, the B1 domain of protein G, from the proton-proton distance information obtained from a NOESY experiment. Download the data file containing the distance information.
curl -O http://www3.mpibpc.mpg.de/groups/de_groot/compbio/p3/restraints.tbl
curl -O http://www3.mpibpc.mpg.de/groups/de_groot/compbio/p3/proteinG.pdb
pymol proteinG.pdb
curl -O http://www3.mpibpc.mpg.de/groups/de_groot/compbio/p3/proteinG.mtf
curl -O http://www3.mpibpc.mpg.de/groups/de_groot/compbio/p3/anneal.inp
curl -O http://www3.mpibpc.mpg.de/groups/de_groot/compbio/p3/protein-allhdg5-4.param
source /usr/opt/cbp/cns_1.3/.cns_solve_env_sh
cns_solve < anneal.inp
curl -O http://www3.mpibpc.mpg.de/groups/de_groot/compbio/p3/sa.pdb
pymol sa.pdb
When the CNS structure calculation has finished, go back to that window and collect the results:
cat anneala_*.pdb > anneal.pdb
pymol anneal.pdb
Question:
Which parts of the structure are well-defined, and which parts show
more ambiguity?
There is also an x-ray structure available of the B1 domain of protein G, available under the PDB code 1PGB. Download it from the Protein Data Bank and compare it to the just calculated NMR structure.
curl -O http://www3.mpibpc.mpg.de/groups/de_groot/compbio/p3/1PGB.pdb
Question: What are the main differences between the NMR and x-ray structures of the B1 domain of protein G? hint
Question:
Which limitations do you think have NMR and x-ray crystallography, respectively?
answer.
Question: How do you expect these settings to change the results?
Principles of protein structure and basic in biophysics and biochemistry:
Advanced reading:
Go back to Contents