Movies
Ubiquitin Allostery
C.A. Smith et al.: PNAS USA 113,3269-3274 (2016)
For movies related to the April 2017 MPIbpc News article about Ubiquitin allostery, please click here.
Cover caption: Allosterically regulated, sub-angstrom contraction of ubiquitin enables binding to USP deubiquitinases (yellow).
Aquaporin
B.L. de Groot and H. Grubmüller: Science 294,2353-2357 (2001)
 Aquaporin-1 in action. Simulation fragment of 200 ps of aquaporin-1.
Generated using Molscript/Bobscript and raster3d. Click here for a higher resolution version.
Aquaporin-1 in action. Simulation fragment of 200 ps of aquaporin-1.
Generated using Molscript/Bobscript and raster3d. Click here for a higher resolution version.
 Pathway of a water molecule through AQP1. Ribbon representation of
one aquaporin-1 monomer and a selection of water
molecules. One water molecule, coloured yellow, finds its way completely
through the pore.
Those sidechains that are in
direct contact with passing water molecules are shown explicitly.
Movie made with Molscript/Bobscript and raster3d. Click here for a higher resolution version.
Pathway of a water molecule through AQP1. Ribbon representation of
one aquaporin-1 monomer and a selection of water
molecules. One water molecule, coloured yellow, finds its way completely
through the pore.
Those sidechains that are in
direct contact with passing water molecules are shown explicitly.
Movie made with Molscript/Bobscript and raster3d. Click here for a higher resolution version.
Images
Aquaporin
B.L. de Groot and H. Grubmüller: Science 294,2353-2357 (2001)
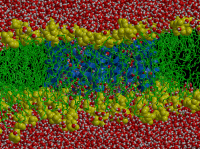
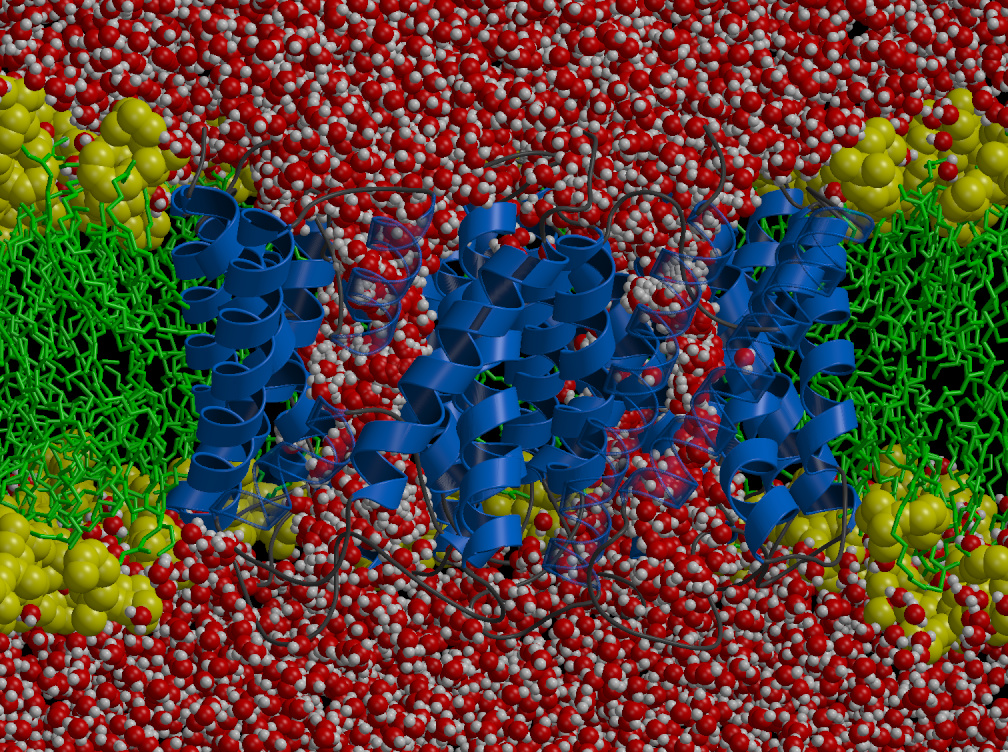
 The periodic simulation system for Aquaporin-1
The protein is active as a tetramer (the monomers are depicted
in orange/cyan/magenta/blue), embedded in a lipid bilayer
membrane (yellow/green) surrounded by water molecules (red/white).
The system size is approx. 100.000 atoms; all simulations were
performed with full electroststics and had a length of 10 ns.
Picture made with Molscript/Bobscript and raster3d.
The periodic simulation system for Aquaporin-1
The protein is active as a tetramer (the monomers are depicted
in orange/cyan/magenta/blue), embedded in a lipid bilayer
membrane (yellow/green) surrounded by water molecules (red/white).
The system size is approx. 100.000 atoms; all simulations were
performed with full electroststics and had a length of 10 ns.
Picture made with Molscript/Bobscript and raster3d.
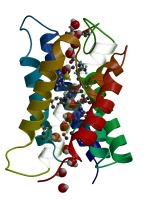
 Aquaporin-1 in action. Snapshot of aquaporin-1 during the MD
simulation, as water molecules diffuse through the pores.
Picture made with Molscript/Bobscript and raster3d. Click here for a MPEG movie of a
trajectory fragment of 200 ps.
Aquaporin-1 in action. Snapshot of aquaporin-1 during the MD
simulation, as water molecules diffuse through the pores.
Picture made with Molscript/Bobscript and raster3d. Click here for a MPEG movie of a
trajectory fragment of 200 ps.
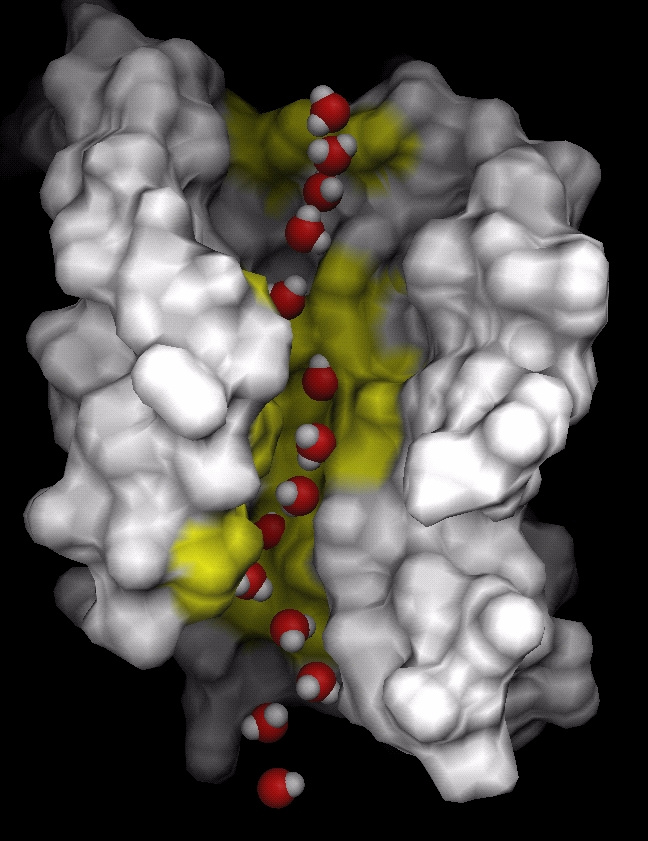 Pathway of a water molecule through AQP1. Surface representation of
one aquaporin-1 monomer and, superimposed, overlaid snapshots of a water
molecule on its way through the pore. The regions of the protein that
interact strongest with passing water molecules are shown in yellow.
Picture made with Dino.
Pathway of a water molecule through AQP1. Surface representation of
one aquaporin-1 monomer and, superimposed, overlaid snapshots of a water
molecule on its way through the pore. The regions of the protein that
interact strongest with passing water molecules are shown in yellow.
Picture made with Dino.
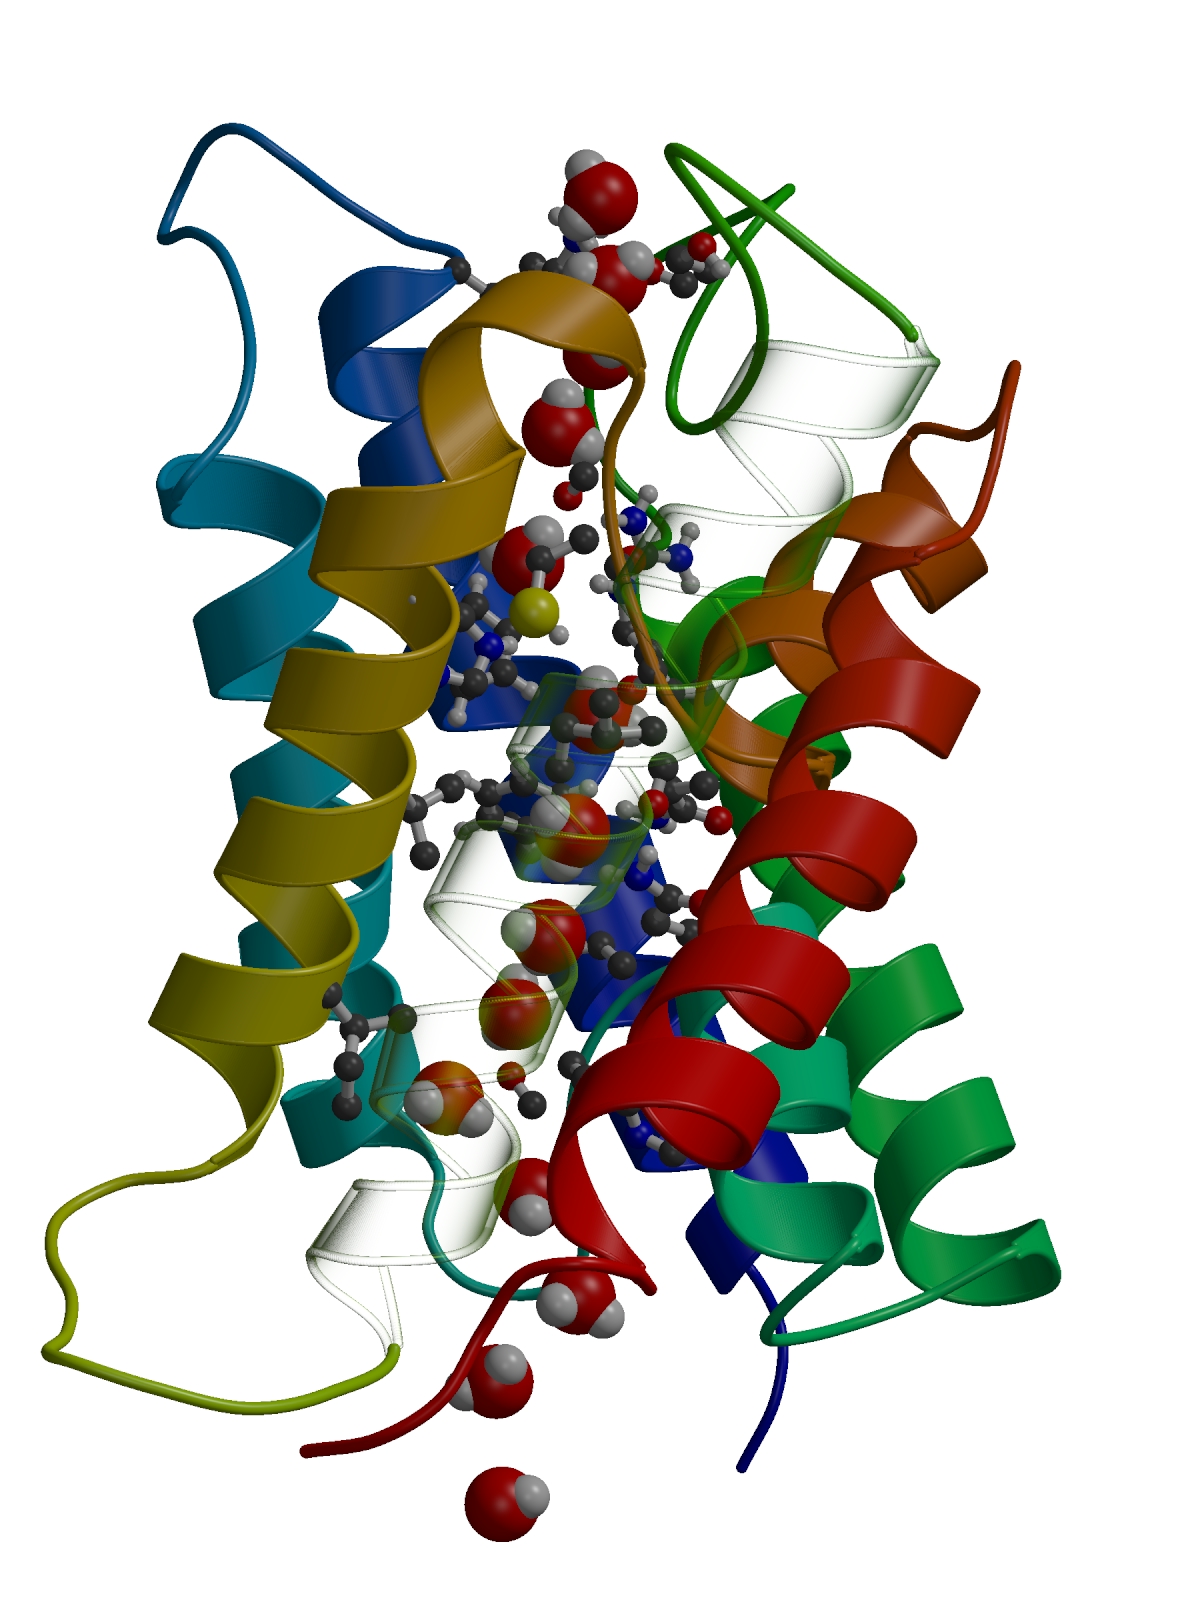 Pathway of a water molecule through AQP1. Ribbon representation of
one aquaporin-1 monomer and, superimposed, overlaid snapshots of a water
molecule on its way through the pore. Those sidechains that are in
direct contact with passing water molecules are shown explicitly.
Picture made with Molscript/Bobscript and raster3d. Click here for a MPEG movie of a permeation
event in a 2 ns trajectory fragment (watch the yellow water molecule).
Pathway of a water molecule through AQP1. Ribbon representation of
one aquaporin-1 monomer and, superimposed, overlaid snapshots of a water
molecule on its way through the pore. Those sidechains that are in
direct contact with passing water molecules are shown explicitly.
Picture made with Molscript/Bobscript and raster3d. Click here for a MPEG movie of a permeation
event in a 2 ns trajectory fragment (watch the yellow water molecule).
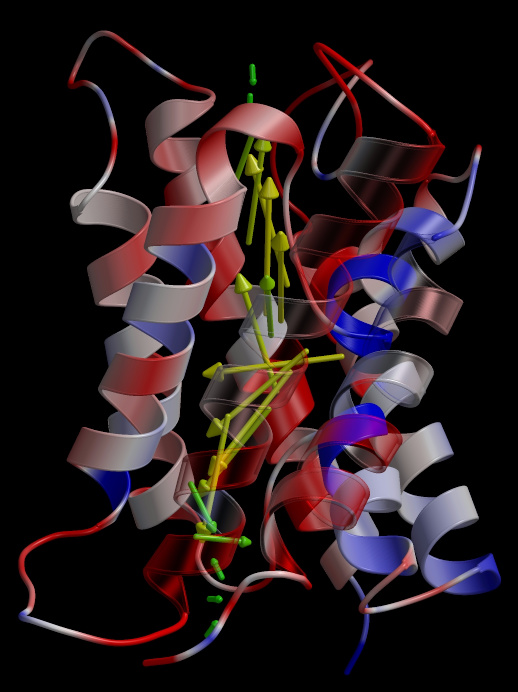 Water dipole distribution in AQP1. Ribbon representation of
one aquaporin-1 monomer and, superimposed, the average dipole moment
of water molecules passing the pore. The water dipole rotates by about
180 degrees on passing the pore. The protein is coloured according to
the local electrostatic potential.
Picture made with Molscript/Bobscript and raster3d.
Water dipole distribution in AQP1. Ribbon representation of
one aquaporin-1 monomer and, superimposed, the average dipole moment
of water molecules passing the pore. The water dipole rotates by about
180 degrees on passing the pore. The protein is coloured according to
the local electrostatic potential.
Picture made with Molscript/Bobscript and raster3d.
 Superimposed trajectories of water molecules through the aquaporin-1
pores. In the ten nanoseconds that were simulated, 16 full permeation events
were observed, in good agreement with the experimental rate.
Picture made with Molscript/Bobscript and raster3d.
Superimposed trajectories of water molecules through the aquaporin-1
pores. In the ten nanoseconds that were simulated, 16 full permeation events
were observed, in good agreement with the experimental rate.
Picture made with Molscript/Bobscript and raster3d.